Process Checklist Reports — Overview
Last updated on: 2026-05-26 | Updated by: MAGNI Docs Team
This page allows administrators and report viewers to configure, generate, and export detailed reports for Process Checklists. By selecting specific report types, date ranges, and filtering criteria (such as customers, categories, and tags), you can analyze checklist execution, track non-conformances, and monitor operational trends.
Overview
The Process Checklists — Report page is a comprehensive analytics tool designed for administrators, auditors, and report owners. It provides deep insights into checklist performance, compliance, and execution status. Users can configure parameters on the Settings tab and view the generated data, charts, and tables on the Report tab.
Page Sections
Navigation and Breadcrumbs
The breadcrumb path at the top of the page helps you navigate back to the main Admin Dashboard or the Process Checklists management screen.
- Admin View: Dashboard / Process Checklists / Checklist - Report
- Standard User View: Dashboard / Checklist - Report
⚠️ If the Checklists feature is disabled for your organization, a "Feature Not Enabled" message will display instead of the reporting interface.
Top Action Bar
The top action bar contains controls for searching, exporting, and printing reports. These controls dynamically appear based on the active tab and whether report data is loaded.
- Search Bar: Allows you to filter the generated report data by keywords. This is only visible when viewing a generated report with active data.
- Export to Excel / Export Visible to Excel: Downloads the report data as an Excel spreadsheet. If the report displays tabular data, this button will export only the visible data in the table. This button is disabled while data is loading.
- Print: Opens the browser print dialog to print the current report. This button is disabled when you are on the Settings tab.
Settings Tab
The Settings tab is the default view where you define the parameters and filters for the report you want to generate.
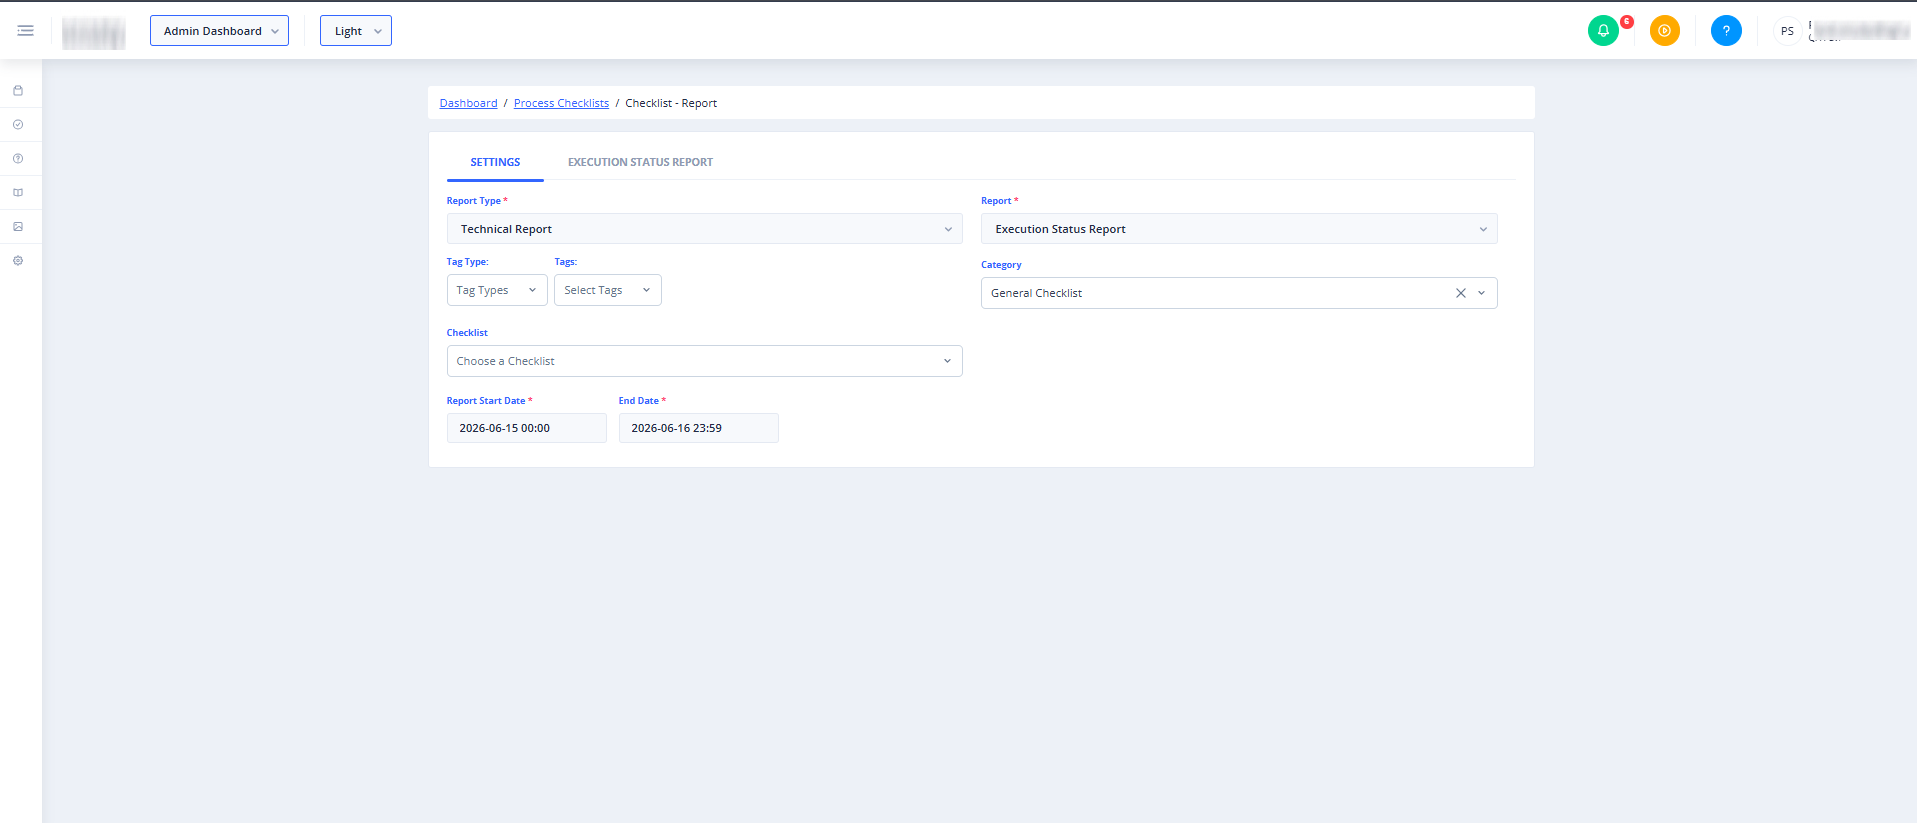
The following fields are available on this tab:
- Customer (Dropdown)
- Purpose: Filters the report data for a specific customer.
- Requirement: Optional.
-
👤 Visible to: THORS Administrators only. This field is hidden when configuring "Checklists Creation Status" or "Overall Checklists Transaction" reports.
- Report Type (Dropdown)
- Purpose: Select the high-level category of the report you want to generate.
- Requirement: Required.
- Available Options:
- Execution Status Report
- Non Conformance Report
- Parameter Trend Report
- Data Export
- Checklist Weightage - Data Export
- Checklists Creation Status
- Overall Checklists Transaction
- Missed Submission Report
- Checklist Schedule Report
- MTTR (Mean Time to Repair)
- MTBF (Mean Time Between Failures)
- Checklist Adherence Report
- Open Issues Ageing Report
- Issues Status Report
- Open Drafts Status Report
- Checklist Non Execution Report
Report Tab
Once you configure your settings and generate a report, the results are displayed on the Report tab. Depending on the selected Report Type, this tab will display interactive charts, data tables, or trend lines.
- Charts and Visualizations: Displays graphical representations of the data (such as bar charts, pie charts, or line graphs for parameter trends and non-conformances).
- Data Tables: Displays detailed rows of records matching your filter criteria.
- Customer Pager: When viewing "Checklists Creation Status" or "Overall Checklists Transaction" reports, THORS Administrators can use the back and forward arrow buttons to quickly page through different selected customers.
Common Actions
| Action | How to do it |
|---|---|
| Configure a Report | 1. Navigate to the Settings tab. 2. Select a Customer (if applicable). 3. Choose a Report Type from the dropdown menu. 4. Fill in any additional required filter criteria that appear. 5. Click the generate button to load the data. |
| Export Report to Excel | 1. Generate your desired report so that the data displays on the Report tab. 2. Click the Export to Excel (or Export Visible to Excel) button in the top action bar. 3. Save the downloaded file to your local device. |
| Print a Report | 1. Navigate to the Report tab containing your generated data. 2. Click the Print button in the top action bar. 3. Configure your printer settings in the browser dialog and click Print. |
Tips
- Use Specific Filters: To prevent slow loading times on large datasets, apply specific date ranges and tag filters on the Settings tab before generating your report.
- Exporting Large Reports: If you need to perform advanced offline analysis, use the "Data Export" report type and click "Export to Excel" to download the raw data.
- Print to PDF: You can use the Print button to save a clean, formatted PDF copy of your charts and reports by choosing "Save as PDF" in your browser's print destination settings.