Checklist Reports Dashboard
Last updated on: 2026-05-26 | Updated by: MAGNI Docs Team
This page allows administrators and report viewers to view multiple Product Checklist reports (widgets) together on a single, auto-refreshing dashboard. By selecting a Tag Type, Tags, Category, date range, and refresh interval, you can monitor execution, adherence, non-conformance, and issue trends across categories in real time, without having to open each report individually..
Overview
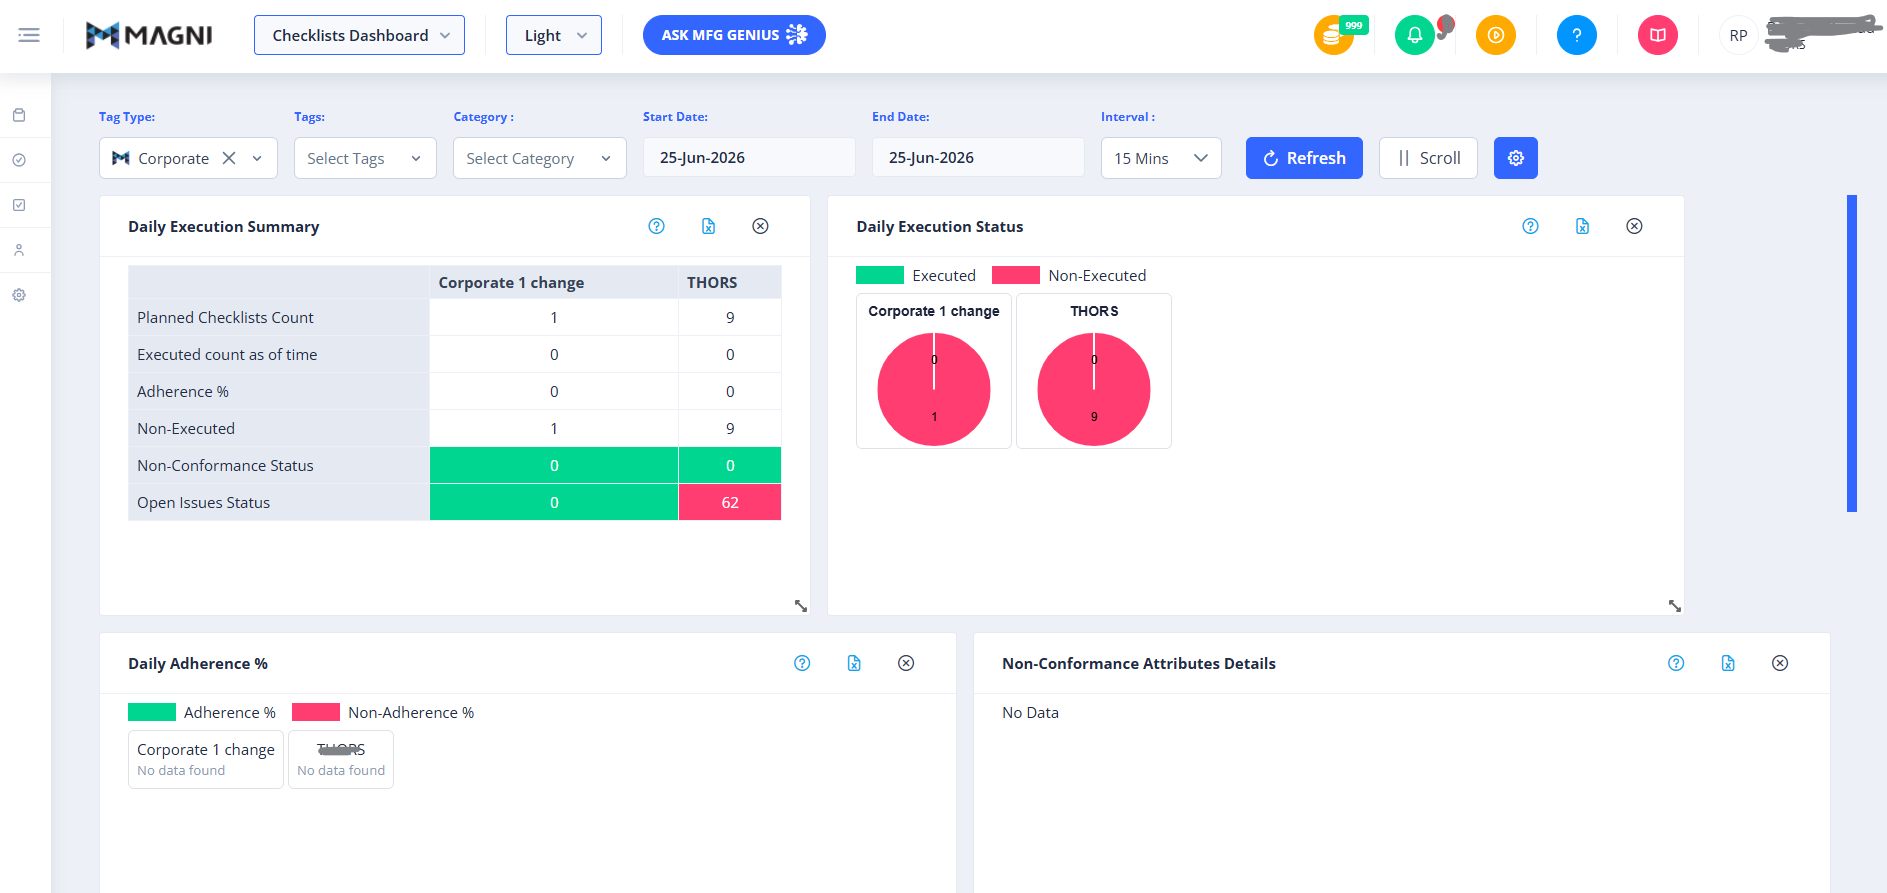
The Report Dashboard is a consolidated, at-a-glance view of the Product Checklists reporting suite. Instead of generating one report at a time, users can enable multiple widgets and view them side by side on a single screen. The dashboard can also auto-refresh at a set interval, making it suitable for display on shop-floor screens, TV walls, or monitoring stations. Users configure what data the dashboard shows using the filter bar at the top, and control which widgets are visible using the Widget Configuration panel.
Page Sections
Navigation and Breadcrumbs
- Admin View: Menu / Product Checklists / Dashboard
- **Standard User Menu / Product Checklists / Dashboard
⚠️ If the Report Dashboard feature is disabled for your organization, the Dashboard menu option itself will not be displayed in the menu. Clicking this menu option opens the Report Dashboard page.
Top Action Bar
The Action Bar sits at the top of the dashboard and controls or filters the data shown across all enabled widgets.
-
Tag Type (Dropdown)
-
Purpose: Selects the type of tag to filter checklist data by (e.g. Plant).
-
Requirement: Required.
-
Tags (Multi-select Dropdown)
-
Purpose: Filters the dashboard to only the selected tags (e.g. specific plants/locations). Shows a count of selected items (e.g. "6 items selected").
-
Requirement: Optional.
-
Category (Dropdown)
-
Purpose: Filters data to a specific checklist category.
-
Requirement: Required.
-
Start Date / End Date
-
Purpose: Defines the date range for which data is displayed across all widgets.
-
Requirement: Required.
-
Interval (Dropdown)
-
Purpose: Sets how often the dashboard automatically refreshes itself with new data. Available options: 15 Mins, 30 Mins, 60 Mins.
-
Requirement: Default.
-
Refresh Button
-
Purpose: Manually refreshes the dashboard immediately, without waiting for the next auto-refresh interval.
-
Scroll Button
-
Purpose: Starts (or pauses) automatic scrolling of the dashboard page, so widgets cycle into view automatically — useful for unattended display screens. Toggling it again pauses the scroll.
-
Settings (Gear) Icon
-
Purpose: Opens the Widget Configuration panel, where users choose which widgets appear on the dashboard.
Widget Configuration Panel
Opened via the setting(gear) icon, this side panel lists every available widget as a checkbox. Enabling a checkbox adds that widget to the dashboard; disabling it removes it.
Available Widgets:
- Daily Execution Summary
- Daily Execution Status
- Non-Conformance Attributes Details
- Non Conformance Ageing report
- Issue Status Details
- Open Issues Ageing Details
- Inspection Status
- Non-Execution Details
- Execution Duration Validation
⚠️ Customer-dependent widgets: The Open Issues Ageing Details and Issue Status Details widgets are only available if the Issues feature has been enabled for that customer. If it is not enabled, these widgets will not be shown on the dashboard, even if selected.
A Save button at the bottom of the panel applies the selected widget configuration to the dashboard.
Dashboard Widgets
Once enabled, each widget appears as its own panel on the dashboard. Every widget panel includes a common set of controls in its header:
- Help Icon (?): Hover to view a short description of what the widget reports on.
- Export to Excel Icon: Downloads that widget's data as an Excel spreadsheet.
- Close (X) Icon: Removes/cancels that widget from the current dashboard view.
Widget Details:
- Daily Execution Summary: A table showing Planned Checklists Count, Executed Count, Adherence %, Non-Executed, Non-Conformance Status, and Open Issues Status, broken down by category.
- Daily Execution Status: Shows Executed vs. Non-Executed counts per category, color-coded (green = Executed, red = Non-Executed).
- Inspection Status: Displays the review status of all submitted inspections. Each record includes the IR Number, Checklist Name, Current Status (such as New, Rejected, Approved, or Pending), QA Inspector, Reviewer, QA Manager, and the Inspection Date and Time. This report helps users track the progress of inspections, identify pending reviews, and monitor completed or rejected inspections.
- Open Issues Ageing Details: A color-coded table grouping open issues by age bucket (Less than a day, 1 to 3 days, 3 to 5 days, 5 to 30 days, More than 30 days) per category, with a Total column and row. Only visible if enabled for the customer.
- Non Conformance Ageing Report: A table of non-conformances (Name, Section, Parameter, CT, #Occurrences), filterable by a built-in date range dropdown (e.g. Last 30 days).
- Non-Conformance Attributes Details: The data represents all Non-Conformance Attributes observed for the selected date and time
- **Issue Status Details:**The Issue Status Details section displays a pie chart representing the distribution of issues by status, including New, Assigned, In Progress, On Hold, Resolved, Closed, and Invalid.
- **Non-Execution Details:**The Non-Execution Details section displays the list of checklists that were not executed on the selected date, based on the selected category and tags.
- **Execution Duration Validation:**The data shows the checklists and submitter names where the checklist was executed in less than the defined duration.
Common Actions
| Action | How to do it |
|---|---|
| Configure Dashboard Filters | 1. Select a Tag Type. 2. Select one or more Tags. 3. Select a Category (if applicable). 4. Set the Start Date and End Date. 5. Select a refresh Interval. 6. Click Refresh to load data. |
| Export Report to Excel | 1. Generate your desired report so that the data displays on the Report tab. 2. Click the Export to Excel (or Export Visible to Excel) button in the top action bar. 3. Save the downloaded file to your local device. |
| Remove a Single Widget | 1. Locate the widget on the dashboard. 2. Click the X (close) icon in its header. |
| Auto-Scroll the Dashboard | 1. Click the Scroll button to start automatic scrolling through widgets. 2. Click it again to pause scrolling. |
| Auto-Refresh the Dashboard | 1. Select a refresh Interval (15/30/60 Mins) in the filter bar. 2. The dashboard will automatically reload data at that interval. |
Tips
- Check Customer Settings: If Open Issues Ageing Details or Issue Status Details widgets don't appear after enabling them, confirm the Issues feature is enabled for your organization.
- Export for Offline Analysis: Use each widget's Export to Excel icon individually if you only need one widget's data rather than the full report.